Illustris Sept 2015 (classifying simulated galaxies.)
-
 by
Budgieye
moderator
by
Budgieye
moderator
Classifying simulated galaxies.
taken from Blog: New images for Galaxy Zoo! Part 2 – Illustris https://blog.galaxyzoo.org/2015/09/21/new-images-for-galaxy-zoo-part-2-illustris/ https://blog.galaxyzoo.org/2015/09/21/new-images-for-galaxy-zoo-part-2-illustris/
Illustris
...new data comes from the Illustris Project. Illustris is a state-of-the-art simulation of the Universe, led by a large team of researchers in the US, UK, and Germany. Large-scale cosmological simulations are a critical tool in astronomy; since we don’t have laboratories where we can replicate the conditions of processes like galaxy formation, we use computer simulations to investigate them instead. Such simulations start with what we believe conditions in the very early Universe were like (which we infer from the cosmic microwave background), and can include both dark matter and baryons (particles like protons and neutrons that eventually form the stars, dust and gas in galaxies). The simulation then tracks what happens to the matter and energy over billions of years as the Universe expands, evolving according to the laws of physics that are programmed into the simulation. This includes relations like the law of gravity, which dominates how dark matter moves, and hydrodynamics, which describe the motions of the gas. It’s truly amazing – scientists can watch galaxies form and evolve over huge scales of distance and time, and compare the results to real observations to test if the physics of the simulations are correct. Illustris is one of the largest and most detailed simulations ever run, taking more than 19 million CPU hours to run on powerful supercomputers.
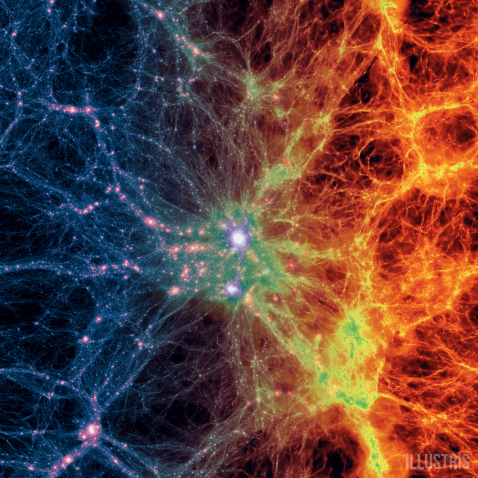
A large-scale projection through the Illustris volume at redshift z=0, centered on a massive cluster. The left side of the image shows the density of dark matter, while the right side shows the density of the gas in cosmic baryons.
A large-scale projection through the Illustris volume at redshift z=0, centered on a massive cluster. The left side of the image shows the density of dark matter, while the right side shows the density of the gas in cosmic baryons. Image and text courtesy of the Illustris project.This comparison to real data is the key feature that sparked the collaboration between Illustris and Galaxy Zoo. Once the simulation is run, astronomers analyze the results to see if their galaxies match the properties of those seen in the real Universe. This includes measurements like the
total number of stars formed,
the ratio of stars to dark matter,
and the distribution of galaxies of different masses and luminosities.
Another critical parameter we want to compare is galaxy morphology; measuring the ratio of ellipticals to spirals, for example, is an important test of whether the galaxy merger rate is correct, and if the simulation codes for star formation and gravitational interaction are correct.
The Illustris scientists have created images of the galaxies from their simulation that GZ volunteers will classify by their morphology. Our comparison data set for this will be the SDSS results from Galaxy Zoo 2, and the images are designed to match the Sloan images as closely as possible. This includes the same set of filters for the telescope, sizing the images so that the galaxies look like they’re at cosmic distance from the Milky Way, and setting them against backgrounds of stars and other galaxies. The quality of the simulations and images are amazing – these look to me like real galaxies in every way. It’s something that astronomers definitely couldn’t do ten years ago.

Two galaxies from the Illustris simulation evolving in time from left to right, from when the universe was a quarter its current age, to the present. The top galaxy shows a massive, red, elliptical-shaped galaxy forming after a series of mergers with other systems. The bottom galaxy reveals the formation of a smaller, bluer, disk-shaped galaxy forming after a less violent history of interactions. Images and text courtesy of the Illustris project.
Two galaxies from the Illustris simulation evolving in time from left to right, from when the universe was a quarter its current age, to the present. The top galaxy shows a massive, red, elliptical-shaped galaxy forming after a series of mergers with other systems. The bottom galaxy reveals the formation of a smaller, bluer, disk-shaped galaxy forming after a less violent history of interactions. Images and text courtesy of the Illustris project.Although these images aren’t of “real” galaxies, we want to emphasize again how much your classifications will help scientists to do astronomical research. Simulations like Illustris are the only way that we can probe galaxy formation and evolution as it happens. Your classifications, both from Galaxy Zoo 2 and from the new Illustris data, provide vital tests for the output and will be fed back to the science teams in order to improve future versions of these sims.
If you have questions or want to discuss anything you see in the new images, please join the discussion with scientists and volunteers on Talk. The Illustris Project also has some amazing online tools if you want to learn more, including an interactive explorer of the simulation and videos of the evolving Universe. You also can explore specific galaxies you’ve classified via GZ:Examine. As always, thanks to everyone for your help!
Talk: Illustris - new images and science https://talk.galaxyzoo.org/#/boards/BGZ0000001/discussions/DGZ0001kab Some questions answered . I have copied some excerpts.
The color balance in the Illustris images is mostly driven by the
asinh stretch that you mentioned, originally developed by Robert
Lupton. Paul Torrey has made some adjustments to the GZ images,
particularly in trying to balance the appearance of the blue and green
blobs that many users have already noticed in the spiral galaxies.
Those are a result of the way that light from very young stars are
rendered in the simulation, and the first iterations didn't resemble
most spiral galaxies as they appeared in SDSS. We've made some manual
rebalancing of the colors as a result, although you can see that some
of the blobs are still there.Please classify them as you would an SDSS galaxy, including weird
blobs if you see them; if those end up affecting your assessment of
the morphology, that's important data that we can use to analyze
either the image rendering or the physics that produce the sims.
Blog: “Blue stuff” in the Illustris galaxy images November 11, 2015 by Kyle Willett https://blog.galaxyzoo.org/2015/11/11/blue-stuff-in-the-illustris-galaxy-images/
“Blue stuff” in the Illustris galaxy images
I think the most common question/comment we’ve been seeing for classifiers of the simulated Illustris galaxies is along the lines of: “What’s the blue stuff?”
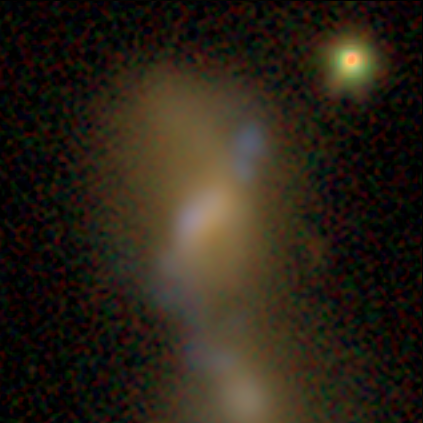
Image of a synthetic galaxy (AGZ00089n5) from the Illustris simulation, being classified in Galaxy Zoo.
Image of a synthetic galaxy (AGZ00089n5) from the Illustris simulation, being classified in Galaxy Zoo. Blue-ish emission can be seen extending from the lower left to upper right of the center galaxy.It’s a great question. Let’s talk about it in more detail.
The short answer is that the blue regions are the simulations’ method of reproducing the light emitted by young stars. A star’s lifetime generally scales as a function of its mass – the more massive the star is when it’s first formed, the hotter it is and the faster it burns fuel. Emission from hotter objects will tend to be bluer (ie, produce more photons at shorter wavelengths) compared to less massive stars. These are trends we see in optical images of stars in galaxies, including naked-eye views and composite color images. The exact color depends on the filters being used as well as processing of the images – that’s the difference between images you may have seen of star-forming regions being pink in some images and blue in others, such as those in Illustris.
A couple more specific questions that we’ve received:
What’s causing the blue colors in the galaxies? Are they caused by individual atomic or molecular lines that we can see in the spectra?
Volunteers who worked on the original GZ green peas project might be familiar with the term “nebular emission” – individual, narrow lines caused by ionized or hot gas surrounding stars, or whether they’re the result of the broadband colors of the stars themselves. The GZ-Illustris images use a stellar population model that only computes the broadband colors, due to some issues with unrealistic green images caused by the interaction of the codes that deal with both the emission lines and effects of dust. The model we’re using – based on work by Bruzual & Charlot (2003) – omits the emission lines for that reason. However, we’ve made extensive comparisons of the two sets of images and find that they agree very well for our scientific goals, including the morphology classifications.

A plot of the synthetic spectra for galaxies in the Illustris simulation; each thin horizontal line is the spectrum of an individual galaxy. The most massive galaxies are at the top, while the lowest mass galaxies are at the bottom. Wavelength increases from left to right, or going from bluer to redder colors. The lack of sharp features in this plot (which uses the BC03 model adopted by the Galaxy Zoo images) are a result of excluding the nebular line emission. Figure courtesy P. Torrey (MIT/Caltech).
A plot of the synthetic spectra for galaxies in the Illustris simulation; each thin horizontal line is the spectrum of an individual galaxy. The most massive galaxies are at the top, while the lowest mass galaxies are at the bottom. Wavelength increases from left to right, or going from bluer to redder colors. The lack of sharp features in this plot (which uses the BC03 model adopted by the Galaxy Zoo images) are a result of excluding the nebular line emission.
A plot of the synthetic spectra for galaxies in the Illustris simulation; each thin horizontal line is the spectrum of an individual galaxy. The most massive galaxies are at the top, while the lowest mass galaxies are at the bottom. Wavelength increases from left to right, or going from bluer to redder colors. The lack of sharp features in this plot (which uses the BC03 model adopted by the Galaxy Zoo images) are a result of excluding the nebular line emission. Figure courtesy P. Torrey (MIT/Caltech).
How should visual morphology classifiers deal with the star-forming regions? Ignore them and look at the underlying stellar populations? Treat them as part of the galaxy? Something else?
This is a tough one. Many galaxies have the “blobby” star-forming regions but others have nicer looking disk or spiral distributions. Our analysis suggests is that this is a pretty tight function of the total star formation rate (higher SFR = more realistic looking features). We suggest that users treat them as part of the galaxy; it might lead to some odd results in lower mass galaxies, but we expect they should trace each other very well for the more massive galaxies. If you see geometry that’s distinctly different from a well-formed spiral disk or elliptical, don’t be hesitant to click the “Anything Odd” or “Other” buttons – that’s one of the simplest ways in which we can measure the unusual effects of the blue regions, given the constraints of our classification scheme.

One option for measuring the effect of the blue blobs is to select “Other” under the “Anything Odd” question.
The distribution of the blue blobs is often disconnected and/or in unusual shapes compared to Sloan. What determines the spatial distribution of the star forming regions?
This results from the extremely discrete sampling of the density of stars in the images. Stars can only form in “chunks” of about 1 million solar masses, instead of the more typical small clusters and regions that we know exist in the real Universe. Moreover, these chunks have their light spread over a significant fraction of ~1 kpc (which is pretty big, compared to a typical galaxy radius of ~20 kpc), and so they often won’t look much like real star-forming regions. This, coupled with the lack of dust, leads to what you see in the GZ images.
IIllustris website: Galaxy Formation on a Moving Mesh Simulating cosmological volumes with unprecedented physical fidelity.http://www.illustris-project.org/
Posted
-
 by
johnadams231
by
johnadams231
Will you be able to see illustris-like objects with the James Webb space telescope ?
Posted
-
by
zoob1172
Webb will enable 'seeing' blurry objects better. There won't be any surprises like Illustris simulations.
Posted
-
by
Budgieye
moderator
The illustris type galaxies are simulations, and I really hope that no galaxies like some of them don't exist. But JWST will find out!
The James Webb Space Telescope will collect infrared light.
The galaxies that we look in visible light will look different.

JWST will look at distant galaxies, whose light has been redshifted so much that their light has changed to infrared wavelengths. See this link
PAGE 2 Galaxy Redshift Chart https://talk.galaxyzoo.org/#/boards/BGZ0000007/discussions/DGZ0000ulp?page=2
JWST will also look at star formation and planet formation.
Posted