Artifact in the middle of a spectrum
-
 by
Budgieye
moderator
by
Budgieye
moderator
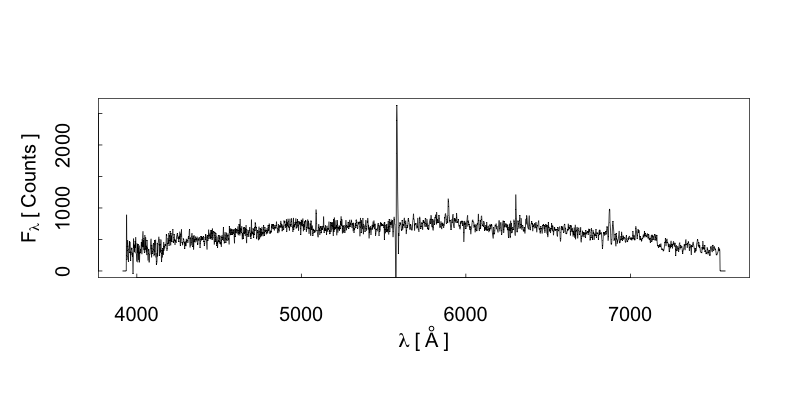
It was a guess based on observation that the peak is too thin to be an actual peak. It must be an artifact.
I have seen it in CFT telescope observation, but this is a different telescope, so might not be the same.
There is an atmosphere artifact about there sometimes too,
http://ned.ipac.caltech.edu/results/NEDspectra_output_80_page1_details.html#2MASX_J12451189-1331235_1
All 6dFGS data taken prior to 2002 October used 600V and 316R
reflection gratings, covering 4000–5600 Å and 5500–8400 Å,
respectively. Subsequent data uses Volume-Phase transmissive
Holographic (VPH) 580V and 425R gratings from Ralcon Development
Laboratory, with improved efficiency, focus and data uniformity. The
wavelength coverage is 3900–5600 Å and 5400–7500 Å and the grating and
camera angles (and hence dimensionless resolutions) are identical. The
peak system efficiency (good conditions and acquisition, wavelengths
near blaze, good fibres) is 11 per cent, but can be much less.The 6dF Galaxy Survey: samples, observational techniques and the first data release http://adsabs.harvard.edu/abs/2004MNRAS.355..747J
or as atmosphere airglow
Out of curiosity, what is the spike (and ginormous blueshifted
absorption line) at G all about?That is a residual from poorly subtracted airglow. Even from sites
with no light pollution, there is a permanent natural glow (vaguely
like a dim aurora) tat gives spikes in the spectrum of anything we
look at. The strongest of these is usually from neutral oxygen at 5577
Angstroms. Typically, one takes data in a way that will allow
subtraction of this - the SDSS does it by having a number of optical
fibers in each data set which are pointed at blank sky. If the
wavelength scales between the object data and blank-sky fibers haven't
been corrected to exactly the same zero point, the sky contribution is
subtracted slightly offset in wavelegth (giving the big
positive/negative patern like this). The green trace shows the
expected error at each wavelength; in this one, the residual pattern
almost wipes out the error peak at 5577.Re: Tutorial bits on galaxy spectra http://www.galaxyzooforum.org/index.php?topic=1923.msg156352#msg156352
================
Perhaps you can decide which is the correct explantion.
Posted
-
Thanks for the extensive answer! Very informative,
Hmm yeah does seem to look a bit like the airglow up and down spike example, difficult to see exact position. I'll probably dig in later to see if there's more to unearth to decide.
And finally learned what the green line actually represents in the 'older' SDSS spectra images 😃
Posted
-
So the NED page states ''Sky Subtraction: Yes'' and also links to a FITS file. The FITS file literally contains the spectrum information, which is nothing other then a small rectangular line of brighter and darker areas / pixels.
Going to the 'External Resource' link and entering the right coordinates in the Menu driven access form gets below image of the spectrum and some thumbnails of the galaxy in different wavelenghts.
Pretty obvious here the line is definitely going up and down at 5577 Angstroms, so I think this is due to the sky substraction line which should have nullified the neutral oxygen 5577 Angstroms. But likely it was placed slightly to the left and created an apparent big absorption line or downward spike exactly like the example you provided from ye olde forum.
NED Page: http://ned.ipac.caltech.edu/results/NEDspectra_output_80_page1_details.html#2MASX_J12451189-1331235_1
6dF Spectrum Page: http://www-wfau.roe.ac.uk/6dFGS/cgi-bin/show.cgi?release=dr3&targetname=g1245119-133123&tid=-1&specid=62495&ra=191.299625&dec=-13.5231111
Posted
-
by
Budgieye
moderator
Yes, the green line in the SDSS dr7 shows the effect of the atmosphere.
Every now and then, the Sloan Digital Survey Telescope points at a blank place in the sky when doing spectrum. Then it subtracts the blank from the other nearby spectra. It is automatically done in dr8 and higher, so it is not so obvious.
Below 4000 Å , the UV light does not penetrate the earth's atmosphere easily.
At 5000 Å and 6000 Å , there are blips due to oxygen and nitrogen airglow creating light.
Above 7000 Å the water in the atmosphere makes a mess of the data.
At about 1000 Å , the atmosphere absorbs the infrared light.
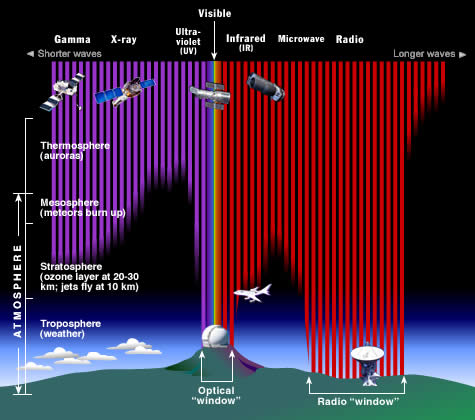
https://imagine.gsfc.nasa.gov/Images/science/EM_spectrum_atmosphere.jpg
https://imagine.gsfc.nasa.gov/science/toolbox/emspectrum1.html
Same galaxy in SDSS dr12, where sky is automatically subtracted.
http://skyserver.sdss.org/dr12/en/get/SpecById.ashx?id=814098237341329408
http://skyserver.sdss.org/dr12/en/tools/explore/Summary.aspx?id=1237656537514770572
Posted