The Masters et al. "passive red spirals" in MaNGA 1st data release
-
 by
mlpeck
by
mlpeck
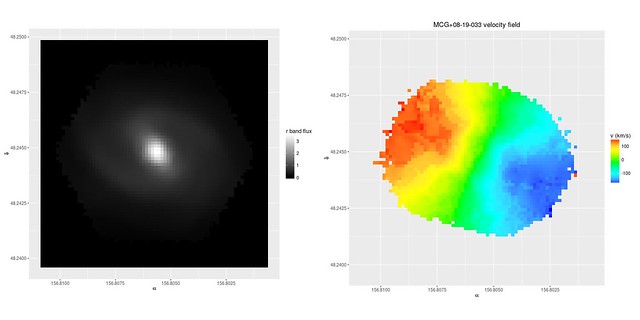
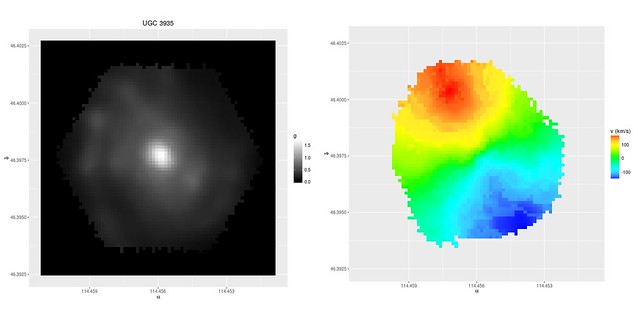
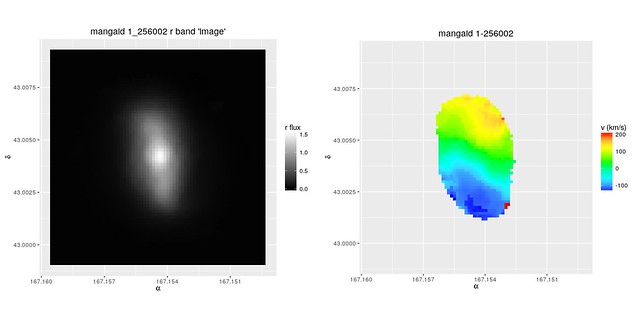
I'm referring to the sample analyzed in Masters et al. 2010 and Tojeiro et al. 2013. There are 3 in the first data release of SDSS MaNGA:
This is mostly a placeholder that I plan to edit further as time permits.I'm just trying to get ahead of the flood of papers that are on the way with predictions from my own data analysis "pipeline." Just to be clear, the graphs below are entirely my work using software I developed completely independently of the SDSS data analysis pipeline or any other publicly available codes.First, here are g or r band "images" taken from the fits files containing the data cubes and my computed velocity fields for these three targets, in the same order as the above images. Two of these I posted previously in the topic "Manga targeting?". All three are rotating, as expected since all are clearly spirals.
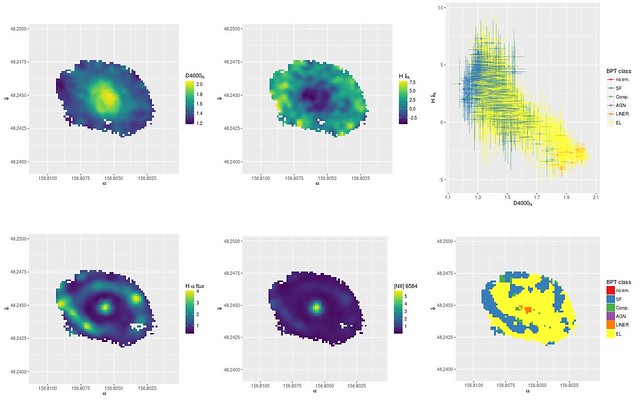
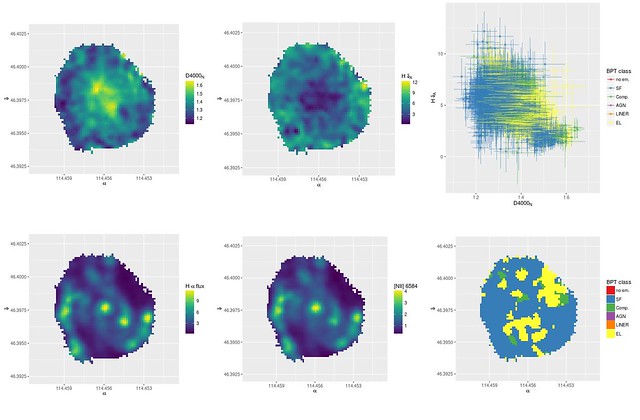
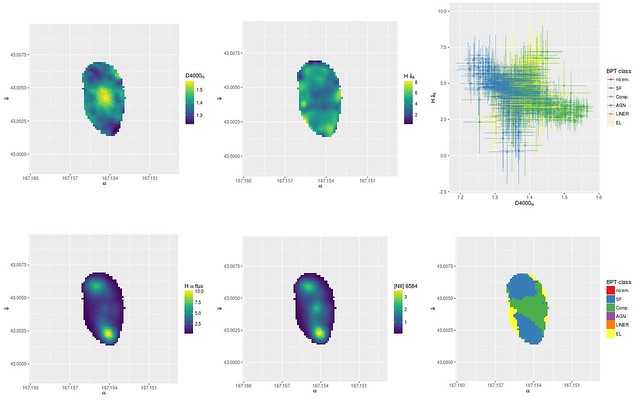
Next are some selected line index and emission line flux estimates for each galaxy. In order from top left these are:
- The 4000Å break strength index D4000n
- The (pseudo) Lick index HδA, which is the most popular index of Balmer absorption line strength.
- A scatter plot of the previous two, with estimated 1σ uncertainties. This is a very popular diagnostic diagram in recent literature. Color coding is by BPT class.
- Hα emission line flux.
- [N II] 6584 emission line flux.
- A map of the BPT class derived from the ratios of [N II]/Hα and [O III]/Hβ using divided lines commonly adopted in the literature (sorry for the lack of cites! Maybe later.). In addition to the usual I have a class I label "EL" which are spectra that aren't classifiable in the BPT diagram because of one or more non-detections, but which do have at least one detected (at the 3σ level) emission line.
Absorption line strengths are corrected for emission and emission line fluxes are corrected for stellar absorption.
Posted
-
 by
klmasters
scientist, admin
by
klmasters
scientist, admin
@mlpeck - this is really impressive. Lots of stuff to interpret here.
The velocity fields look twisted. That's really interesting, and potentially hints at radial flows (maybe related to the bars).
They are all older centrally than in the outskirts - inside out quenching, which is a signature of internal processes being the most important.
One of these looks like an example of LINER emission from a low luminosity AGN which could be linked to AGN feedback.
One of these has SF at the ends of the bars - which is a sign again of the bar impacting the SF properties of the galaxy.
Lots of cool stuff.
Posted
-
by
mlpeck
in response to klmasters's comment.
@klmasters - Thanks! I'm having a lot of fun with these.
I was eventually going to get around to noting that the SDSS fiber missed significant activity in two out of the three galaxies here, and both of those have prominent bars.
I had a hard time sorting out the morphology of the third galaxy here (so did GZ2 classifiers). It looks like there's a prominent bar, either a ring or a pair of tightly wound spiral arms attached to the bar, and short hooked "appendages" at the intersections of the bar with the ring. Those appendages turn out to be giant HII regions with vigorous star formation. How vigorous remains to be quantified, but a preliminary rough estimate is specific star formation rate is as large as ~10-10 -- 10-9.5 /yr.
I still have a lot to learn about kinematics.
Posted
-
by
mlpeck
I was going to do followup posts on this topic, but I realized it was pointless to use Talk for that purpose so I decided to write a paper instead. Which took months. That's because I expanded the scope of what I wanted to do, I'm a slow writer, and I have other things to do. But I finally have a draft. A draft that's way too long, for which I apologize.
By the way the paper isn't about red spiral galaxies. To my knowledge I am the first person to implement fully Bayesian models of spectral energy distributions with what Conroy calls non-parametric star formation histories. That's what the paper is about, and I'm giving away the code too. I just picked a conveniently small sample as a case study and tried to do a credible job with the astrophysics to demonstrate that the models do useful things.
I put a project copy on Overleaf and have opened it up for read only access here: https://www.overleaf.com/read/kxrmpkqvdmbs.
I really don't like Overleaf's pdf previewer and am not that fond of its editor either. If you'd like to look at the pdf in your own reader here's a copy on Dropbox as well.
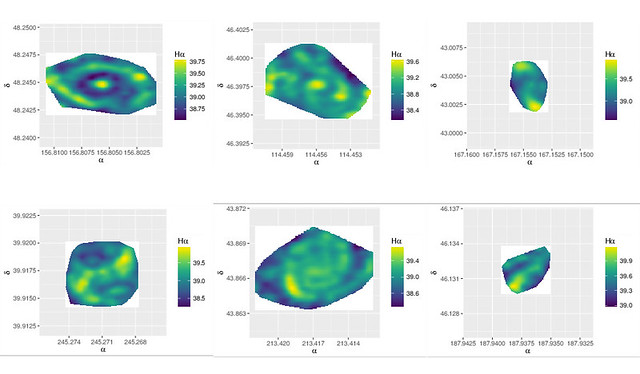
To tease a few results, here are maps of Hα luminosity -- the top row are the three red sample galaxies that were in the first MaNGA data release. The bottom row are three blue sample galaxies that I thought were similar morphologically:
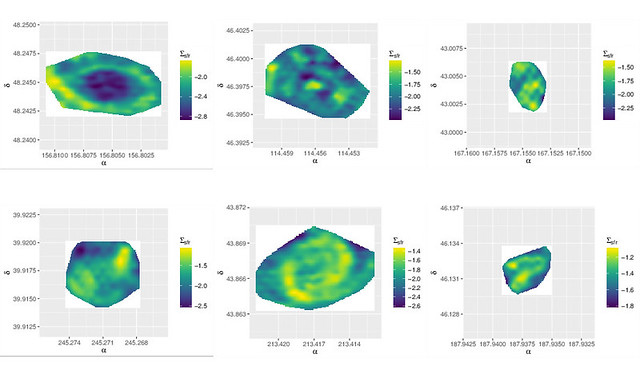
And here are star formation rate densities (units are log M[sun]/yr/kpc^2)
Posted
-
by
mlpeck
SDSS data release 14 went live on 31 July: https://arxiv.org/abs/1707.09322; MaNGA data cubes are up to 2812 (according to the arxiv doc) from 1390 in DR13. Here's a quick updated census of GZ related data sets in the latest release. I've taken catalogs either from the GZ data page or Vizier. Check the link for references. Counts are from position matches.
- Masters et al. red spirals: 3 -- none were added from DR13.
- Masters et al. blue spirals: 66 -- I think there were 37 in the previous release.
- Schawinski blue ellipticals: 4
- Darg mergers: 45 unique (32 primaries and 14 companions; one is an apparent dual agn)
- Kaviraj dusty spheroidals: 11
- Hoyle bar lengths: 105
I had Schawinski's AGN catalog decoded at one time but I lost it, so no count there. I might also check objects in the memory holed quench project sometime.
Just about every object I've checked has Galaxy Zoo 2 classifications, so there are lots of those.
If anyone wants lists, just ask.
Posted
-
by
mlpeck
I was asked about the Darg mergers sample, so here are lists. These were obtained by cross matching positions in the Darg catalog with the v_2_1_2 version of MaNGA's drpall catalog.
Here are a few entries from the catalog: SDSS id, position, morphology, stage. First, object 1 in MaNGA
            object1       ra1       dec1 morph1 stage
 587725491063750953 259.87466 55.4329910      e     2
 587725503945048077 253.88902 63.2421840      s     2
 587725550127153216 133.79793 54.9282950      s     1
 587725576426356739 262.09927 57.5453950      s     2
 587725993040740662 255.10153 38.3517000      s     2
 587729227151704160 238.28610 54.1472740      s     2
 587729652888830146 254.30978 34.0240480      s     2
 587731521207992450 138.98137 44.3327830      s     2
 587731521747419237 145.54163 48.0128670      s     1
 587732154181484658 149.96829 45.2830850      s     1
 587736619864555734 246.61963 24.0257340      s     2
 587737809028645097 114.37415 41.7372550     su     2
 587737809564532781 112.57339 39.9419400      s     2
 587737825675903269 121.61156 50.1197010     su     2
 587738197188215137 117.33778 52.3511200      e     3
 587738372209049979 125.39503 23.2066540      s     2
 587739096451842194 182.66437 36.6144910      e     3
 587739719216988184 194.38313 28.4769440      e     2
 587739811020341405 205.32117 26.2720510      s     2
 587741386202218596 127.63200 18.2061100      s     2
 587741603109732518 195.01770 28.1551070      s     2
 588007004164194442 132.54471 51.7754100      e     2
 588011101034774582 241.90721 45.0653310      s     3
 588013382196592801 148.89777 45.5548020      s     2
 588013383267057856 139.19315 42.5067710     eu     2
 588015507680723008  50.18886 -1.0539570     su     2
 588015509293170866  54.39030  0.1448045     su     2
 588017626685964389 164.97313 43.3697470     su     2
 588017721712050292 164.41078 41.0549320      s     2
 588017722255540381 184.66510 43.5386470      s     2
 588017978362626177 203.85303 38.0951500     su     2
 588018055654998067 229.52556 42.7458530      s     2
Object 2 in MaNGA:
            object2      ra2     dec2 morph2 stage
 587725551729311872 115.2243 40.06987      s     2
 587725552269656192 120.4372 47.06465      s     2
 587728666117668992 126.8251 46.03261      s     2
 587731186740166656 358.5503  0.37703      e     2
 587732483811770496 146.7891 43.41860      e     2
 587733609086255360 238.1414 46.33993      s     2
 587735695916400768 221.2231 51.34108      e     2
 587738948284645504 156.4031 37.22230      s     2
 587739096451842176 182.6641 36.61377      e     3
 588007005232234880 119.5600 42.26864      s     2
 588017112372936704 195.3193 48.06018      s     2
 588017604148133888 187.0635 44.45314      s     2
 588017605762088960 197.8918 44.93308      s     2
 588017626685964416 164.9711 43.36885     su     2
Here are versions you can copy and paste into Skyserver's Image List tool:
            name       ra       dec
 587725491063750953 259.87466 55.4329910
 587725503945048077 253.88902 63.2421840
 587725550127153216 133.79793 54.9282950
 587725576426356739 262.09927 57.5453950
 587725993040740662 255.10153 38.3517000
 587729227151704160 238.28610 54.1472740
 587729652888830146 254.30978 34.0240480
 587731521207992450 138.98137 44.3327830
 587731521747419237 145.54163 48.0128670
 587732154181484658 149.96829 45.2830850
 587736619864555734 246.61963 24.0257340
 587737809028645097 114.37415 41.7372550
 587737809564532781 112.57339 39.9419400
 587737825675903269 121.61156 50.1197010
 587738197188215137 117.33778 52.3511200
 587738372209049979 125.39503 23.2066540
 587739096451842194 182.66437 36.6144910
 587739719216988184 194.38313 28.4769440
 587739811020341405 205.32117 26.2720510
 587741386202218596 127.63200 18.2061100
 587741603109732518 195.01770 28.1551070
 588007004164194442 132.54471 51.7754100
 588011101034774582 241.90721 45.0653310
 588013382196592801 148.89777 45.5548020
 588013383267057856 139.19315 42.5067710
 588015507680723008  50.18886 -1.0539570
 588015509293170866  54.39030  0.1448045
 588017626685964389 164.97313 43.3697470
 588017721712050292 164.41078 41.0549320
 588017722255540381 184.66510 43.5386470
 588017978362626177 203.85303 38.0951500
 588018055654998067 229.52556 42.7458530


            name      ra     dec
 587725551729311872 115.2243 40.06987
 587725552269656192 120.4372 47.06465
 587728666117668992 126.8251 46.03261
 587731186740166656 358.5503  0.37703
 587732483811770496 146.7891 43.41860
 587733609086255360 238.1414 46.33993
 587735695916400768 221.2231 51.34108
 587738948284645504 156.4031 37.22230
 587739096451842176 182.6641 36.61377
 588007005232234880 119.5600 42.26864
 588017112372936704 195.3193 48.06018
 588017604148133888 187.0635 44.45314
 588017605762088960 197.8918 44.93308
 588017626685964416 164.9711 43.36885
Posted
-
by
mlpeck
About a year ago there was a paper authored by Fraser-McKelvie et al. (2012): "A photometrically and spectroscopically confirmed population of passive spiral galaxies." They claimed to have found a sample of truly passively evolving spirals, some of which they were able to verify with IFU spectroscopic observations. Some of their sample look to me like lenticulars with no obvious spiral features, but some do appear to be actual spirals.
I decided to take a look in the MaNGA sample for galaxies with spiral structure, trying to avoid lenticulars or obviously interacting galaxies, and lacking evident dust lanes or H II regions. My quick and totally subjective survey of the SDSS thumbnails turned up 18 candidates. I probably won't ever analyze all of them, but here's one that's kind of interesting:
Link to Explore page.
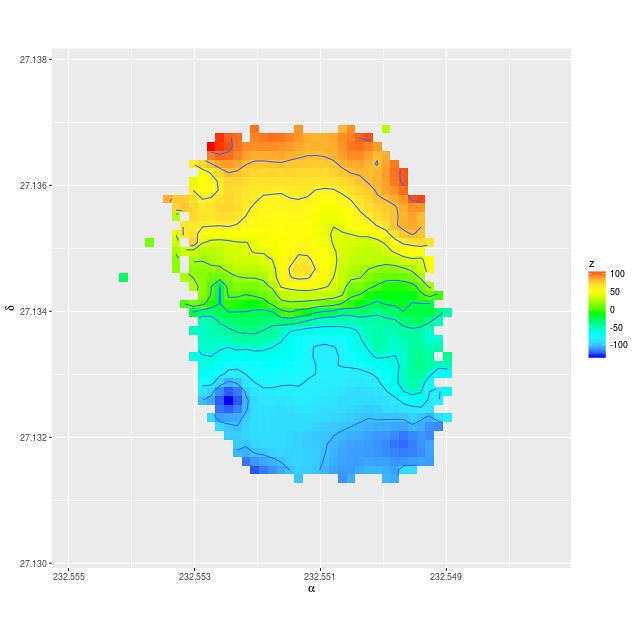
Here's my estimate of the velocity field from the data cube. I have no idea what the significance of this is, but there's a local maximum in the velocity just NE of the nucleus, with a local minimum equidistant on the other side. It almost looks to me as if there might be a torus of material rotating around the nucleus. I also see faint hints of an X shaped surface brightness enhancement, and the local extrema sit right in the vertexes of the X. Perhaps, looking at it again, it's the X that's perturbing the velocity field.
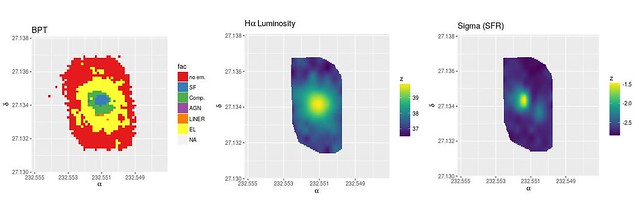
Anyway, here are some results of stellar population and ionized gas modeling. The map of BPT classifications is really interesting and totally unlike a normal spiral. Hα emission is centrally concentrated and only the central region has starforming emission line ratios. All lines get weaker with increasing distance from the nucleus -- Hβ drops out of detectability first, then the rest of the emission lines.
My stellar population models show a peak in the star formation rate density that's slightly offset from the nucleus. I don't think that's very significant -- the spectra have pretty low signal to noise and star formation histories aren't well constrained. Overall they indicate that a long secular decline in star formation occured with everything outside the central region passively evolving at present.
Posted
-
by
klmasters
scientist, admin
Awesome stuff! I'm still incredibly impressed by your analysis of these data.
Posted
-
by
mlpeck
Thanks. I think I am actually the first person to do SED modeling with what Conroy calls non-parametric star formation histories in a fully Bayesian framework, but I'm pushing the limits of what I can do with my current computing resources.
Posted