Selecting MaNGA disk galaxies with GZ2 classifications
-
 by
mlpeck
by
mlpeck
This is part of my ongoing project to estimate disk galaxy rotation curves, but I decided to start a new topic since this is a little less technical and maybe more broadly of interest. Perhaps someone will even have comments or suggestions.
The question is, how to pick a sample of disk galaxies from MaNGA suitable for rotation curve analysis? The Masters et al. spiral sample is a really excellent sample of spiral galaxies but there aren't a lot of them in MaNGA through the second data release (68 unique objects by my count) and a fairly large percentage of those are too close to face on for reliable rotation curve modeling.
Another thought I had for a galaxy zoo tie-in was to use the GZ2 classifications to select probable disk galaxies. The entire GZ2 database is on SDSS Skyserver, so it's sorta straightforward to query it and crossmatch to the MaNGA target database. The one issue I encountered is that even though most (but not all) MaNGA targets are SDSS spectroscopic objects the specObjID isn't listed in the drpall catalog. The best alternative is to use a position crossmatch, which took a while to figure out how to do with SQL queries.
It turns out just about every table in the SDSS database has a variable called "htmID," which according to the schema browser is a "Hierarchical Triangular Mesh ID for fast spatial searches." Well, that's helpful. Unfortunately doing a join of two tables on common values of htmID doesn't quite work because objects can be close enough without having a common htmID. Instead you have to use a table valued function and a form of join that I hadn't heard of previously. Here is the complete query to match MaNGA objects with GZ2 classifications:
select into gz2disks
  m.mangaid,
  m.plateifu,
  m.objra,
  m.objdec,
  m.ifura,
  m.ifudec,
  m.mngtarg1,
  m.mngtarg3,
  m.nsa_z,
  m.nsa_zdist,
  m.nsa_elpetro_phi,
  m.nsa_elpetro_ba,
  m.nsa_elpetro_th50_r,
  m.nsa_sersic_n,
  z.specObjID
from mangaDrpAll m
cross apply dbo.fGetNearbySpecObjEq(m.objra, m.objdec, 0.05) as n
join zoo2MainSpecz z on z.specobjid=n.specObjID
where
  m.mngtarg2=0 and
  z.t01_smooth_or_features_a02_features_or_disk_weighted_fraction > 0.5 and
  z.t02_edgeon_a05_no_weighted_fraction > 0.5 and
  z.t06_odd_a15_no_weighted_fraction > 0.5 and
  m.nsa_elpetro_ba >= 0.5 and
  m.nsa_elpetro_ba ≤ 0.866 and
  m.mngtarg1 > 0
The crucial lines here are the one starting with "cross apply" and the selection criteria at the end. The call to dbo.fGetNearby... is using the htmID to find SDSS spectroscopic objects nearby to each MaNGA target within a 3" match radius, which are then joined to the zoo2MainSpecz table.
I decided to make cuts based on weighted vote fractions for a few different questions in the decision tree, and just to get started I picked more or less arbitrary thresholds: I required a vote fraction for "features or disk" > 0.5, no to "edge on" > 0.5, and no to "anything odd" > 0.5. To refine the selection a little bit to galaxies with moderate inclination I set limits on nsa_elpetro_ba, which is the estimated minor to major axis ratio from the NSA photometric reduction.
That query produced 359 hits. Somewhat surprising to me, I'd say 100% of the objects are disk galaxies. I'm not so sure 100% of them aren't odd in some way.
For anyone with a CASJOBS account I've published the table for public access. My user name is mlpeck and the table name is gz2disks. I'm not sure how to access published tables from another account, but it should be available for read access at least. If you try to run the query yourself be warned that it takes a very long time to finish. It might be best to schedule it for a Sunday or after midnight US time.
Edit: Talk usually interprets ">" as a tag, sometimes even in blocks of literal text. The last line of the query above is "m.mngtarg1 > 0". For some reason the other inequality conditions reproduced OK.Edit2: It was even worse than I thought. The penultimate line should read "m.nsa_elpetro_ba ≤ 0.866 and". There seems to be no right way to include the less than or equal operator into a block of literal text in Talk. Is there any chance Panoptes Talk is better? Will Galaxy Zoo users ever know?
Posted
-
 by
JeanTate
by
JeanTate
< (& l t ; if you put spaces in) produces the less-than symbol; > you get by replacing "l" with "g".
I do not know if there are similar work-arounds for "less than or equal" and "greater than or equal".
This limitation of this version of Talk goes back to its origin, and AFAIK there are no plans to do anything about it.
Posted
-
by
mlpeck
Quick holiday update. The query above produced, as mentioned, 359 hits. There are 356 unique objects, with one having two repeat observations and another having one. The MaNGA team does not as yet (AFAIK) designate a "science primary" observation when repeats are available.
Approximately 15% of the objects have one or more spectra contaminated by foreground stars or galaxy overlaps. The best solution for these I think is to mask the offending spectra by hand and re-run the models. That seems to be the MaNGA team's solution as well since there's an ongoing Zooniverse project to mark interlopers, among other tasks.
In addition to the ones that need some manual intervention there are another 8-10 that turn out to be too close to face on for a reliable rotation curve analysis. There are another 8 or 10 that are unsuitable for rather interesting reasons. I am currently pondering the issue of how to do sample refinement without cherry picking.
I"ll leave off with one object that I think is unique in this data set. Tell me why a model of gas and stars on circular orbits in a thin disk isn't going to work.

Posted
-
by
mlpeck
I notice the top level Zooniverse.org Talk has recently added a data processing section. I wonder if it would be useful to copy some of this material over there. A couple items might be of broader interest:
- SQL queries.
- In particular, using "hierarchical triangular mesh id's" for position based queries and the cross apply command.
- Something I haven't actually talked about: doing bulk downloads using wget.
- Something else I haven't talked about: reading FITS files in R.
Posted
-
by
mlpeck
in response to mlpeck's comment.
Tell me why a model of gas and stars on circular orbits in a thin disk
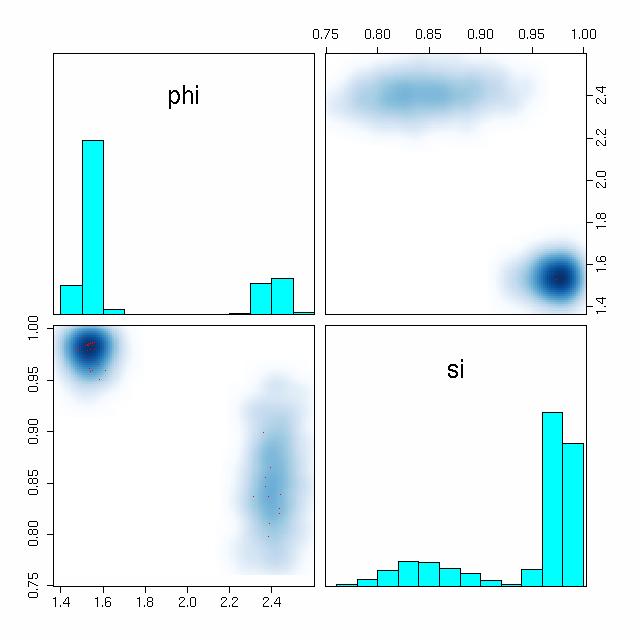
isn't going to work.Nobody's willing to hazard a guess it seems. The problem is this galaxy is bulge dominated. There's a disk in there somewhere I think, and the galaxy is rotating but not like a disk dominated system. The model fails to produce a reasonable rotation curve:
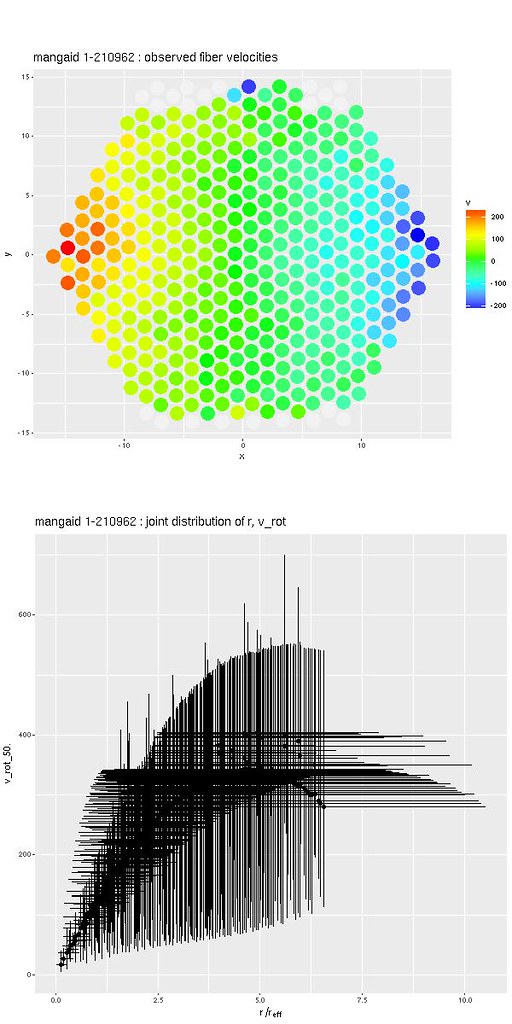
Besides the strange looking rotation curve estimate there are other indicators in the sampler output of problems. This shows what's called a pairs plot of the posteriors of the major axis angle and sine of the inclination. One of the four chains found a completely different mode than the others, while the higher density mode favored a nearly edge on disk (which I think is probably wrong). The estimated photometric major axis angle is right around 90o. The shallower mode favored a kinematic value about 50o larger.
One thing that is kind of interesting in the velocity field is a couple of apparent outliers near the top (north) edge. The SDSS image shows what looks like might be a small disky satellite galaxy that's right at the edge of the IFU footprint. I'm guessing the measured velocity offset is real and we're seeing the satellite falling into the bulge, probably from behind.
Coming up, maybe, if I get around to it before taking another pause -- the two other major causes of failed models. And, perhaps, I'll get around to showing that it's possible to do some real astrophysics with these models. There could even be material for publishable research.
Posted
-
by
mlpeck
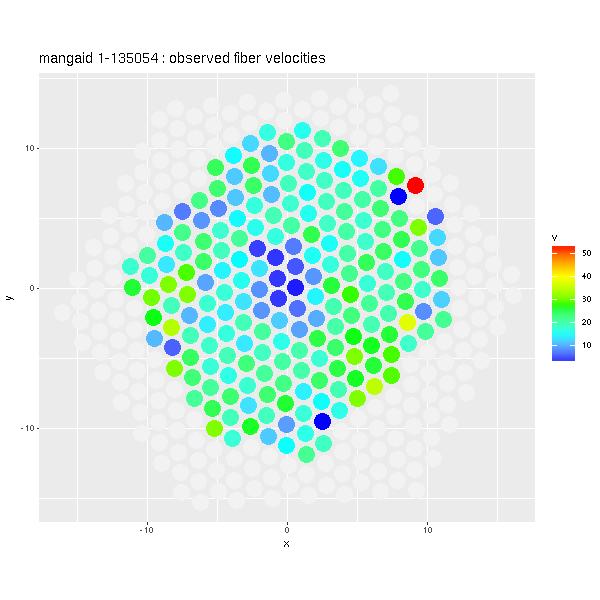
Besides the single case of a galaxy with a dominant bulge there were two major reasons for model failure. First was being too close to face on despite the photometry (as measured by the NSA pipeline) indicating moderate inclination. Here's one example where there's no discernible rotation at all. This galaxy is in a small group and it's possible it is being tidally distorted by a neighbor that appears to be considerably more massive.
The other group of failures look something like this one. GZ2 volunteers thought this was a two armed barred spiral.
Only the bar had high enough S/N spectra to obtain a velocity field:
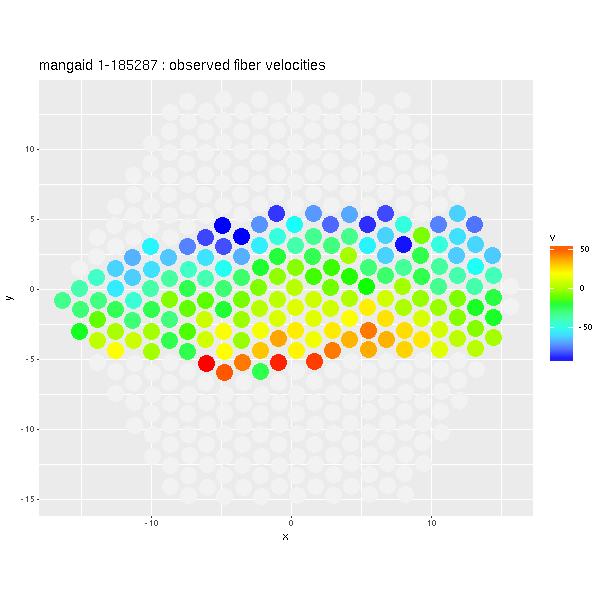
The highest velocities - both receding and approaching - are near the middle of the bar, not the ends. The only scenario that makes sense to me is that we're looking more or less straight down the bar and seeing stars (and/or gas) in highly elliptical orbits.
This was the most dramatic example of this type, but there were 13 objects that had significantly different position angles to the point of maximum radial velocity from the photometric major axis.
Altogether there were 28 galaxies that were removed from the sample for one of these reasons, leaving 331 in the final disk sample.
Posted
-
by
mlpeck
I'm going to conclude with some astrophysics. For the final sample of 331 galaxies I retrieved stellar masses and uncertainties estimated by the MPA-JHU pipeline from SDSS Skyserver via casjobs. I calculated estimated circular velocities (and marginal uncertainties) at 1.5 effective radii from my models -- this could be an extrapolation in some cases, but most of the data sets for individual galaxies go at least that deep. A plot of those two sets of quantities looks like this:
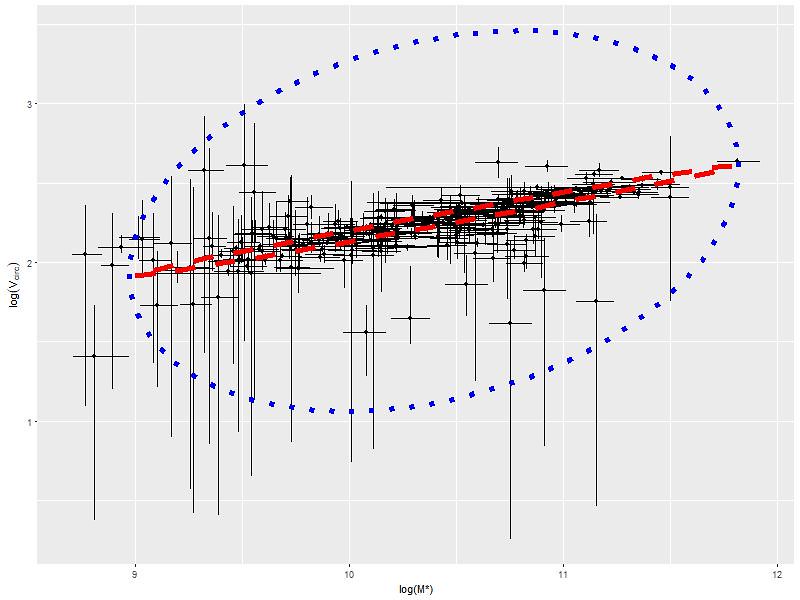
This is one of the more famous empirical relationships in astronomy. It's called the Tully Fisher relation after the original authors. In the form presented here as a relation between stellar mass and circular velocity it's often modified to the Baryonic Tully-Fisher relation. McGaugh et al. (2000) showed that M∼Vc4 holds over a 5 decade range in mass if gas mass is accounted for in low mass galaxies.
The skinny ellipse in the plot is the result of performing "extreme deconvolution" on the data. This implies a very tight relation between mass and velocity with little "cosmic scatter." The slope of the line corresponding to the major axis of the ellipse is 0.24±0.01 (1 σ), which is consistent with 1/4.
Posted
-
by
JeanTate
in response to mlpeck's comment.
Yes, well worth the effort I think. There are likely several people who hang out there, but not here, who might be interested.
Posted
-
by
JeanTate
in response to mlpeck's comment.
It's only bulge-dominated in the MaNGA field of view; there's a nice thin disk, but it's mostly outside the hexagon ...
Posted
-
by
JeanTate
in response to mlpeck's comment.
Cool! 😃
What do the different colors (of the data) mean (red, yellow, cyan, green, magenta, grey)? What is "extreme deconvolution"?
The scatter at low M* is considerable, and my (highly subjective!) eye tells me that the relationship may not hold well there; can this be easily tested? In general, what, do you think, might the outliers tell us, especially those well below the red ellipse?
Posted
-
by
mlpeck
Hi Jean:
I don't have much time, but I'll try to quickly answer.
The term "extreme deconvolution" was coined by Bovy, Hogg & Roweis (2010) although they basically repackaged older ideas. The idea is to extract an intrinsic distribution from noisy data.
It's not clear to me that there are outliers considering the magnitude of observational errors, which are considerably larger at low stellar mass.
The colored points were model runs that showed some signs of convergence problems. I was trying to see if that could account for outliers (if they really exist). I don't think so.
Yes, there are ways to determine if a more complex model is called for.
Posted
-
by
mlpeck
in response to JeanTate's comment.
I don't think so. The top level Zooniverse Talk mostly seems to be a place for Zooniverse volunteers to rant about whatever. Better to try to be more diligent about putting stuff on github.
And on that topic, a quick reminder that everything needed to recreate my rotation curve modeling workflow (I hope anyway!) is at https://github.com/mlpeck/vlos_stanmodels.
Another piece of maintained code that might be useful to some people is a cosmological distance calculator with some related functions organized as an R package: https://github.com/mlpeck/cosmo. I have a Python version somewhere as well, but the cosmological functions in astropy are considerably more full featured.
Posted
-
by
mlpeck
in response to mlpeck's comment.
This is probably my final post on this topic in this venue. I hope I'll have time to write up a better organized and formatted case study soon, but I'm not holding my breath.
I quietly modified the graph near the top of the post to which I'm responding to show in a schematic way why I claimed that it's not clear that there are any outliers present. The basic idea of the "extreme deconvolution" model is that we have observations (strictly speaking these are the results of models themselves rather than straightforward measurements) made with errors. We have estimates of the uncertainties of each measurement. We treat those as known (this is an oversimplification, but best not to get too meta here), and the measured values are modeled as arising from distributions with unknown "latent" (a term of art from statistics) means and known standard deviations. The latent means are then modeled as jointly distributed according to some distribution with mean(s) and covariance matrix(es) to be estimated. Bovy et al. considered the case where the intrinsic distribution is a mixture of normals. I assumed just a single bivariate normal relationship. The estimated covariance matrix of that intrinsic relationship is represented by the skinny ellipse in the plot.
Now, given posterior distribution estimates for all the parameters of the model we can invert the process and predict what new data would look like simply by taking draws from the posterior distribution and randomly generating new data according to the probabilistic model. The fat ellipse in the plot, which is what I added to the original, schematically represents the outcome of that "posterior predictive" modeling (another term of art). What's plotted is a 95% confidence ellipse, which should more or less cover 95% of "future" measurements -- or around 95% of the actual ones if the model is good. In fact I only count about 4 measurements out of 331 outside the ellipse, so if anything it's a little conservative.
So that's my overlong but still too sketchy argument for why it's not clear that there are outliers in this plot. Still, there are things that are worth looking for. Low mass galaxies have large circular velocity uncertainties, which isn't too surprising because most of them have small angular sizes and low surface brightness - hence providing small amounts of noisy data. But there are a number of intermediate to high mass galaxies with very large velocity error bars. What are those coming from? From memory, I think those show evidence for significant noncircular motions and most or all have prominent bars. So, bars need looking at.
Another thing to look at are S0's versus spirals. There are both in this sample and unfortunately there's no obvious way to separate them based on the GZ2 decision tree that I've seen.
Posted